Upon collecting all data for our research, we needed to analyze our results to determine whether oral temperature is related to axilla temperature.

Our variables mainly consists of: gender, age, oral temperature reading, axilla temperature reading and whether participants consumed any hot or cold drinks.
After all the input, we went on to choose Pearson's r as our statistical technique to test as both oral and axilla temperature readings are of scale data.
CORRELATION COEFFICIENT

We can see from the scatter plot that there is a positive linear slope of r=0.413. The spread seems to be equal. As such, the oral and axilla temperature are linearly related as the points clustered around the straight line.
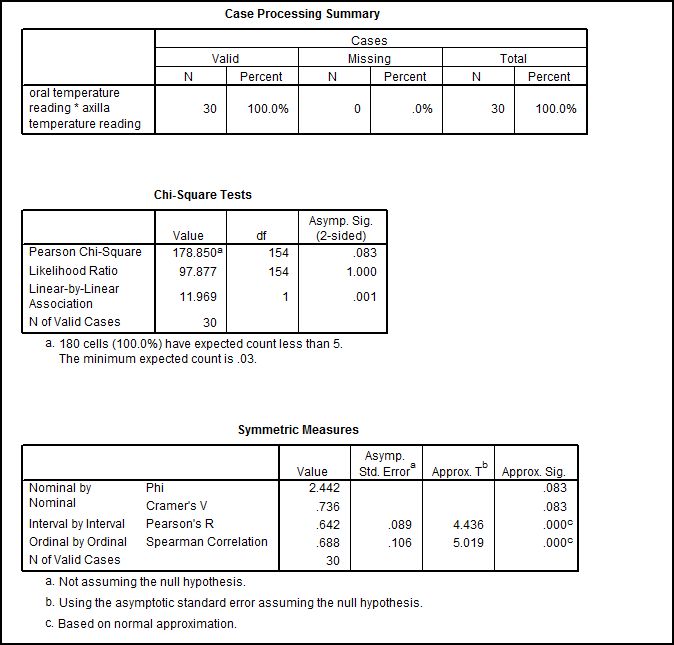
From the symmetric measures data, we can see that p=0.00. Which means that p<0.05. So we will need to reject the null hypothesis and accept the research hypothesis. To determine whether it is a strong,moderate,weak,positive or negative relationship, we look at Pearson's r value which is 0.642.
- Pearson's r = 0.642
- p(0.00) <0.05
- n = 30
Therefore, we can write out our final statement as: There is a strong positive relationship between oral and axilla temperature measurement.
This final statement leads us to know that the higher the oral temperature, the higher the axilla temperature will be.
Although there is a strong positive relationship between the 2 measurement sites, we also went on to determine if there is really a difference between oral and axilla temperature. From the box plot analysis, we can see that axilla temperature measurements have high variability among each participant. The range ranges from 35.4°C to 37.2°C. Therefore, there is really a greater difference from axilla temperature measurement as compared to oral temperature measurement.

No comments:
Post a Comment