Saturday, July 3, 2010

Our research study


INTRODUCTION
We are a group of 3 students from Subgroup 2, NR0924. Our group members consist of Ye Yun, Jevini and Benecia. We have decided to name ourselves as “The Three Musketeers”. We are currently in Year 2 and this is our first time doing a statistics project. The topic we have chosen is – Is a person's oral temperature related to axilla temperature?
We decided to choose this topic as we find that it is very relevant to our nursing practice. In the hospital ward, temperature taking is a simple and common procedure but often it is being underestimated. The common route nurses always take measurements of patients’ temperature is either orally or axillary. However, there is a high chance that the nurses may or may not know if there is any difference between oral and axilla temperature. Just by randomly choosing a site to measure is not effective enough to determine the patients’ temperature. Therefore, in our research, we will need to determine if there is really a difference in temperature reading from orally versus axillary and as a result, affect the patient’s condition.


TESTABLE HYPOTHESIS
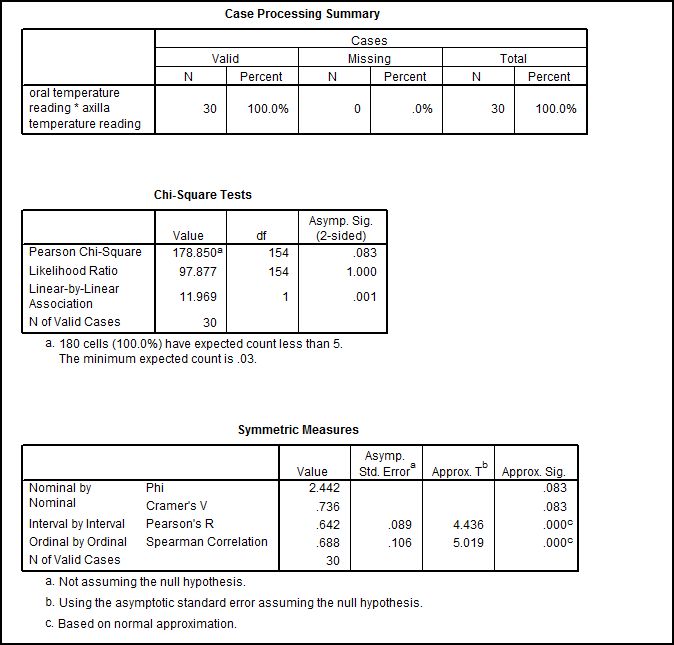
- Null Hypothesis (Ho): There is no significant relationship between oral and axilla temperature measurement.

- Research Hypothesis (H1): There is a significant relationship between oral and axilla temperature measurement.

OPERATIONALIZATION
The instrument – which is the thermometers, are used for our research study purpose only. We used two new thermometers for measurement and the thermometers were calibrated by the manufacturer.

Name: Actherm Digital clinical thermometer
Model: ACT 2020
Thermometer accuracy: ±0.1°C


METHOD OF RESEARCH
~ Briefing and training for researchers
The three of us came together and standardized the measurement site and the method of measuring. We decided on:
  • Oral temperature taking: Place thermometer in the mouth, under the tongue.
  • Axilla temperature taking: Place thermometer on Right side of arm.
Each researcher was given a role to work on throughout the whole data collection process.
  1. Jevini – in charge of briefing the participants and obtain informed consent.
  2. Ye Yun – in charge of taking participants’ axilla temperature measurement
  3. Benecia – in charge of taking participants’ oral temperature measurement

~ Prior to data collection
Before carrying out our research, we conducted a brief introduction to our participants. These were the points that were informed to our participants:
  • The purpose of our research
  • What we will be doing throughout the whole process
  • Obtained written informed consent
  • Confidentiality was assured to every participant. [ All data collected will be kept confidential]

FIRST DATA COLLECTION
Date: 01 July 2010, Thursday
Time: 1330 – 1430hrs
Venue: Outside LTKH1
Sample size: 13 participants (10 classmates + 3 of us)

Informed consent form was given to participants. A data collection list was done up by us. Our researcher, Jevini, asked participants for personal particulars like their age and gender. In the data collection list, we also recorded the participant’s oral temperature and axilla temperature measurement next to their particulars.


Throughout the temperature taking, our participants were in a relaxed and seated position. Temperature taking was much easier as most of them were our classmates. They cooperated with us and provided much support to us. Temperature measurement was done twice on the same site to prevent any mistakes. And the final reading was an average of the two readings. 

After every temperature measurement, the thermometer was cleansed with alcohol swabs and the protective sheath was changed to prevent cross infection from one person to another. This was also a part of personal hygiene.

From the first data collection, we realized that most participants’ oral temperature readings are higher than axilla temperature reading.

  
SECOND DATA COLLECTION
Date: 01 July 2010, Thursday
Time: 1445 – 1600hrs
Venue: North canteen
Sample size: 17 participants (7 classmates + 10 coincidental participants)

For our second data collection, we proceeded to North canteen to search for more participants to take part in our research study.
  
Following the same as our first data collection, a brief introduction was carried out to our participants. Written informed consent was also obtained as well as the participants’ personal particulars.


The same standard procedure of the temperature taking was followed the same way as our first data collection.

It was rather difficult to get more participants for our data collection. All our existing classmates were asked and we needed to invite more participants to take part in our research. We then decided to approach anyone we see in the North canteen and ask them if they are willing to take part. Thank goodness most agreed and we managed to complete our data collection.
STATISTICAL ANALYSIS
Upon collecting all data for our research, we needed to analyze our results to determine whether oral temperature is related to axilla temperature.

 
We keyed in all our data into SPSS.
Our variables mainly consists of: gender, age, oral temperature reading, axilla temperature reading and whether participants consumed any hot or cold drinks.
After all the input, we went on to choose Pearson's r as our statistical technique to test as both oral and axilla temperature readings are of scale data.


CORRELATION COEFFICIENT
 
We can see from the scatter plot that there is a positive linear slope of r=0.413. The spread seems to be equal. As such, the oral and axilla temperature are linearly related as the points clustered around the straight line.
 
From the symmetric measures data, we can see that p=0.00. Which means that p<0.05. So we will need to reject the null hypothesis and accept the research hypothesis. To determine whether it is a strong,moderate,weak,positive or negative relationship, we look at Pearson's r value which is 0.642.

  • Pearson's r = 0.642
  • p(0.00) <0.05
  • n = 30

Therefore, we can write out our final statement as: There is a strong positive relationship between oral and axilla temperature measurement.
 
This final statement leads us to know that the higher the oral temperature, the higher the axilla temperature will be.
 
Although there is a strong positive relationship between the 2 measurement sites, we also went on to determine if there is really a difference between oral and axilla temperature. From the box plot analysis, we can see that axilla temperature measurements have high variability among each participant. The range ranges from 35.4°C to 37.2°C. Therefore, there is really a greater difference from axilla temperature measurement as compared to oral temperature measurement.
 
CONCLUSION
~ Implication of our findings:
Temperature measurement accuracy is important in the clinical setting. As such, we need to measure accurately to effectively diagnose patient's condition. Inaccurate or false reading can hinder the medical intervention. As such, we need to be consistent in our temperature measurement and the thermometers used.


~ Limitations of our research study:
1) Some of our participants consumed hot or cold water prior to the test. And this may actually affect the reading, causing inaccuracy

2) Some participants wore certain clothing that can affect temperature measurement. For example, some wore long sleeve tops that can hinder the measurement of axilla measurement.

3) The temperature measurement takes up to a few minutes and some participants felt that it was rather long. We should have informed them earlier about this so that they are aware.

4) There may be a need for us to manually calibrate the thermometers despite it being new. It can in addition, confirmed that the two thermometers have the same exact reading at the same time, at the same site.

5) Our sample size is rather small to show the true findings of the research. We will need more participants in our research.
REFLECTIONS
The data collection was made possible because we did it in a systematic and planned way. After their consent had been taken, they proceeded to 2 stations where participants could go to, to take their oral and axilla temperature. Eventually there were a few difficulties we faced along the way. For example, it was difficult for us to place the thermometer on those who were wearing long sleeved shirts. And for some of the participants who did not want us to help them or were too shy to slot in the thermometer without their clothes being uncovered from the area, placed it wrongly and not so accurately. But in all, the data collection turned out to be successful and we managed to collect sufficient amount of data which helped us tremendously in our research.
~By Jevini~

It was really an enjoyable experience to work together with my two other researchers. Although there were some hiccups along the way, it still turns out to be a good outcome. Doing the statistical analysis was rather tough and we faced some difficult. Nevertheless, we manage to get it solved out and presented our final blog. I will like to thank all our participants who take time and effort in participating in our research. It was really appreciating and all of them really helped us a lot for our project. And not forgetting, Ms Chia, who has been teaching us the topics step by step for us to understand easily.
 ~By Benecia~

This was my first time to conduct a research with my two other researchers. Even though there are only three persons in our group, I am satisfied with our team work. It was really a great experience for me to learn from each other and  I have enjoyed the whole process. I really want to give great thanks to our participants for their good cooperation. I think it is a meaningful experience, and I am quite happy to see what we did.
~By Ye Yun~